
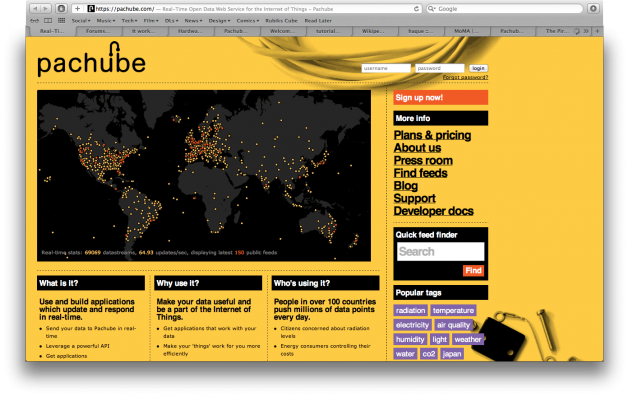
Pachube is an internet concept, based in East London, for collecting, handling and sharing various forms of data accumulated through manual input or automatically from attached devices such as electricity meters and weather stations.
This data can then be stored and shared in real-time in a variety of ways from “live” graphs, charts and widgets to SMS alerts. There is also the ability to create and link mobile applications to the data further extending the possibilities such as augmented reality viewers.
Using Pachube, individuals, developers and businesses can create applications, services and products that use the data created by connected devices. In doing so, Pachube allows users to share, collaborate and make use of the information generated by the world around them.
Currently, Pachube users send more than seven million datapoints to the service each day, averaging 60 a second. What makes Pachube stand out above other data collection concepts is the mobile factor; allowing users to add time and geolocation metadata.
Pachube itself publishes many apps that can be used for sharing the accumulated data and there are many more available that have been contributed by the developer community.
Many of the apps provide a means to present real-time data on the web; therefore any user could add a widget of a chart/graph to their own personal website that would automatically display the live data of a source of their chose, such as home electricity usage.
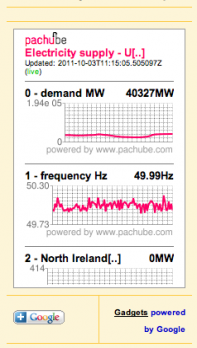
The app to the left has been created for users to add to their iGoogle page, essentially allowing users a quick glance at the data when casually browsing. Seeing as usual iGoogle widgets are for weather and stocks this seems to fit perfectly in with the idea of quickly and efficiently keeping track of changing data.
Pachube
The app above is a flash based plugin that displays the real-time data in the form of dial. Updating every 15 minutes.
The app itself wasn’t created by Pachube but instead published by a developer in the Pachube community. It’ll be interesting to see whether I can conceptualise an app to publish, especially considering the Flash skills learnt in Level 4 last year.
One of the apps that intrigues me most is the augmented reality viewer app, Porthole.
Like most augmented reality apps the data is displayed overlaying the hardware collecting the data. A QR code is used so the camera of a mobile device can detect which data stream to display.
The Pachube iPhone app allows on the fly, manual input of data; perfect for temperature and other simple data values.
I intend to experiment with both the manual input from the iPhone app and an automated input from a device such as an Arduino and run a comparative data streams on a single feed.
This example of a Pachube feed shows a user gathering data based upon the electricity usage in their home. Hooked up to track the electricity meter readings the data is collected and ready for analysing and sharing.
The map shows the geolocation of the data gathered, in this case Australia. There are also several line graphs showing the usage in Volts, Watts and Amps.
I will try establish a similar feed with the electricity data from my own home, I could even extend the concept by adding QR codes to certain devices, such as the TV, and displaying their individual power use through the augmented reality app available.
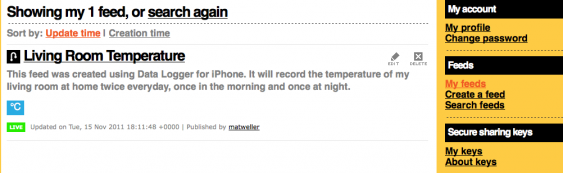
The above graph is a live real-time embed of a Pachube datastream of mine that records and collects the temperature of my home living room. The data is input manually by me using the DataLogger iPhone application after reading a traditional thermometer in the room.
I'm interested in automating the process and obtaining more accurate results by purchasing and building my own Arduino board with an Ethernet shield. That way I'd be able to attached a three-wire analog thermometer to the device and have readings automatically uploaded to Pachube every hour, on the hour. The idea for this came from talking with Paul Tanner in the Pachube workshop and presentation we had in the module in November. This would also tie in with the physical computing aspect of the lectures we touched on.
The Pachube iPhone app allows on the fly, manual input of data; perfect for temperature and other simple data values.
I intend to experiment with both the manual input from the iPhone app and an automated input from a device such as an Arduino and run a comparative data streams on a single feed.